Mojito R Analytics Overview
This component allows you to create fully-templateable experiment reports for Mojito Snowplow/Redshift, using R Markdown and HTML.
Note: Use restricted users with read-only access (We assume your analysts are good actors).
Features
- Measure tests against a series of configurable metrics
- Measure changes in time to convert
- Goal counts / conversion depth reports for measuring frequency / user loyalty (e.g. user transacted 2 or more times)
- Diagnostics to check for SRM issues and variant code errors
Prerequisites
- RStudio installed
- Snowplow with Redshift as a Storage target
- Exposure & Conversion tables generating properly
Getting setup
1. Create a reports folder with the following files inside:
- The Knitr report template
- The Mojito functions R files
- (Optional) A script to connect to your Redshift instance (must store the connection in the
convariable)
As an example, your reports directory may resemble:
{{Department/Project/Client}}_name/- mojito-functions/
{{reports version}}/- reports.R
- plots.R
- ...
- wave_report_
{{Wave number}}.Rmd - wave_report_
{{Wave number + 1}}.Rmd - ...
- mojito-functions/
2. Next, install the R dependencies if you don't already have them:
# Used for generating the reports
install.packages(c("ggplot2", "scales", "reshape", "ztable", "dplyr", "jsonlite"))

# Used for connecting to Redshift via RJDBC
install.packages("RJDBC")
3. Install pngquant for image compression (recommended due to the large uncompressed images outputted by ggplot2 and knitr)
See the pngquant website for instructions.
Create a test report from the knitr template
1. Ensure the path to the Mojito functions and Redshift connection script (if needed) are pointing to the right files
# RDB connection - expose SQL connection through `con` global variable
library(RJDBC)
.jinit()
driver <- JDBC("com.amazon.redshift.jdbc42.Driver", "RedshiftJDBC42-1.2.1.1001.jar", identifier.quote="`")
con <- dbConnect(driver, paste0("jdbc:redshift://mycluster.redshift.amazonaws.com:5436/snowplow?ssl=true&sslfactory=com.amazon.redshift.ssl.NonValidatingFactory&user=",username,"&password=",password))


# Load Mojito functions
for (lib in c("reports","plots","tables","queries_snowplow_redshift","experiment_sizing")) {
  source(paste0("./mojito-functions/",lib,".R"))
}
2. Update the wave_params with details of the experiment like its ID, client name, start/end dates, unit and recipe names
wave_params <- list(

  # Client name, used for directing R to pull from the correct tables
  client_id="mintmetrics",

  # The experiment ID
  wave_id="ex1",

  # Start and end timestamps (for active experiments, just set a date in the future)
  start_date="2019-05-15 09:19:45",
  stop_date="2019-06-05 14:29:00",

  # The time grain used in the plots
  time_grain="hour",

  # The unit of assignment for test subjects (used in table resolution)
  subject="usercookie",

  # The recipes included in the test - This is used to order recipes (The control group should show first), or filter treatments out (e.g. leave a recipe out to exclude it)
  recipes=c("control","treatment")
)
3. Define a list of metrics for use in the report
Metrics can be defined in a list and the report builder will iterate through each metric:
goalList <- list(
list(
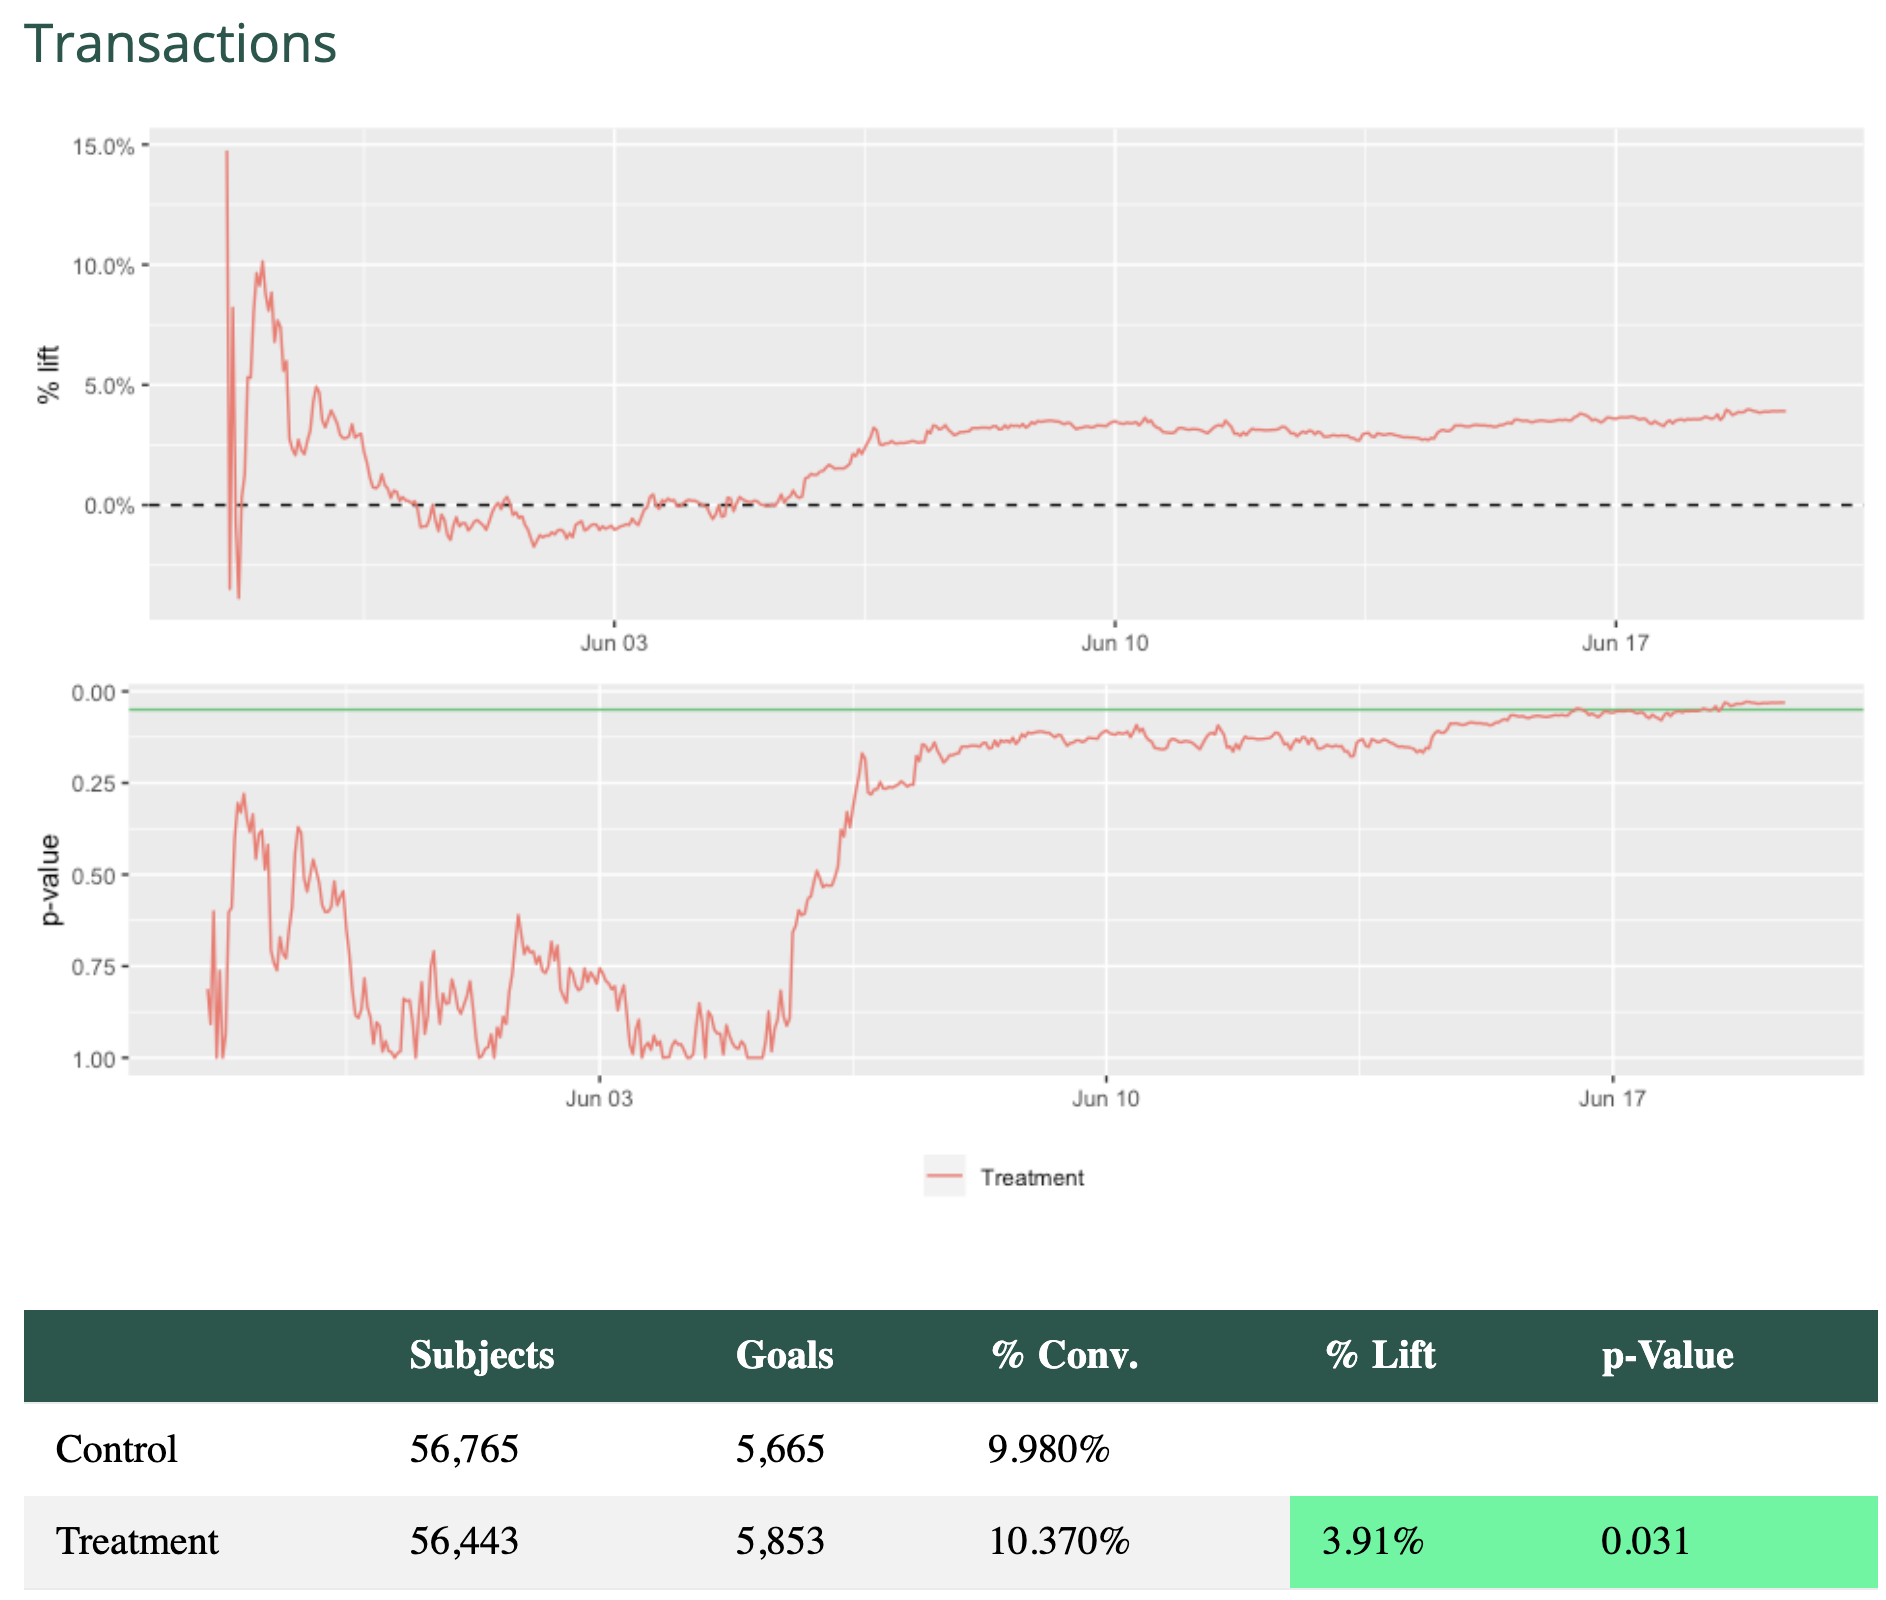
title = "Transactions",
goal = "purchase",
operand = "="
)
)
goalList <- mojitoFullKnit(wave_params = wave_params, goal_list = goalList)
Debugging
Like all Rmarkdown templates, you can step through the code in the report to make sure it's outputting what you like.
If you hit any problems, you may like to run this command to show the last query run before the reports failed:
cat(last_query)
Likely causes to why the query / report failed:
- Recipe names in report differ from those used in the knit's
wave_paramslist - Dates may be wrong or not ISO8601 compatible
Getting involved
We're keen to help you get set up - Open issues with any problems you encounter. If you want to contribute, we'd be keen for help with BigQuery support and checking our assumptions.
Eventually we'd love to add Bayesian inferential stats to our reports - we're currently playing with it, but not fully comfortable with it yet for production reports.
Reach out via: